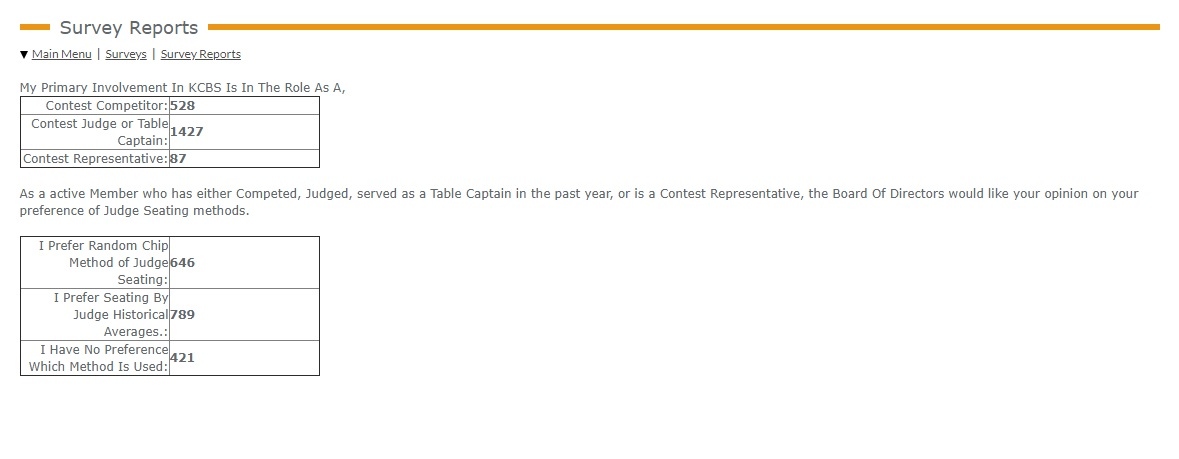
Survey Results
The Survey has finished and the members polled have chosen to return to a historical averaging method by a margin of 143 VotesThe Board will be taking recommendations from the Technology Consultants on the available data and procedures to implement a system for Contest Officials.
We Anticipate a system to be recommended to the Board in the June Meeting. Work has been underway since the beginning of the survey to implement a system based using current and reliable data available.
The Results and associated census reporting is offered for review.
| Identifying Factor | Number of Participants | Random | Averaging | No Preference | |||||
| Contest Competitor | 371 | 95 | 228 | 48 | |||||
| Contest Competitor, Contest Judge or Table Captain | 141 | 38 | 82 | 21 | |||||
| Contest Competitor, Contest Judge or Table Captain, Contest Representative | 12 | 2 | 9 | 1 | |||||
| Contest Competitor, Contest Representative | 4 | 3 | 1 | 0 | |||||
| Contest Judge or Table Captain | 1257 | 488 | 434 | 335 | |||||
| Contest Judge or Table Captain, Contest Representative | 17 | 5 | 7 | 5 | |||||
| Contest Representative | 54 | 15 | 28 | 11 | |||||
| TOTALS | 1856 | 646 | 34.81% | 789 | 42.51% | 421 | 22.68% | ||
| Participation Factors | Email Sent | Opened | Responded | Opened & Responded | |||||
| Cooks | 2888 | 37.46% | 1658 | 57.41% | 524 | 18.14% | 31.60% | ||
| Judges | 4609 | 59.79% | 3208 | 69.60% | 1427 | 30.96% | 44.48% | ||
| Contest Representatives | 212 | 2.75% | 157 | 74.06% | 83 | 39.15% | 52.87% | ||
| TOTALS | 7709 | 5023 | 65.16% | 2034 | 26.38% | 40.49% |